


Subsequent to my statistical-computational analysis in a previous op-ed for the Iowa Standard, Iowa Democrats have attempted to refute the math-science of what I already have proven with metaphysical certitude. Unfortunately for them, that effort was weak, superficial, glancing, and non-sequitur. Dems don’t really do math well, and are surprisingly anti-science (e.g., see ranging from human embryology to economic science to meteorology). Here’s where their analysis falls apart:
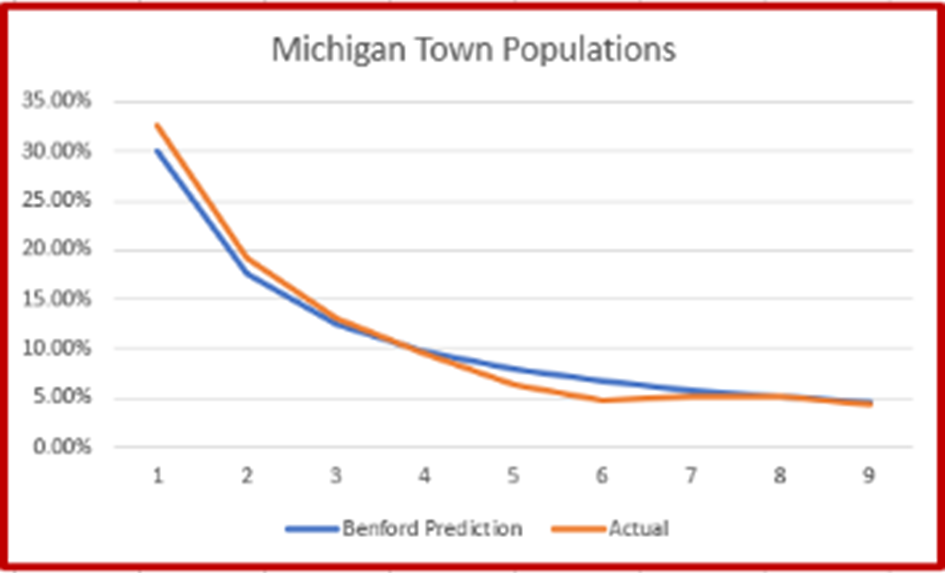
First of all, I’m glad that the Left agrees with me that Benford’s Law is very helpful in ferreting out fraud in various industries. They make my point for me that Michigan town populations follow the Benford law almost perfectly. That’s why Michigan is a good fit for an election analysis.
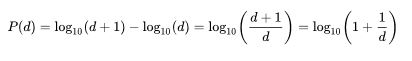
Secondly, some Leftists do not like Benford’s Law because of an insistence that these population areas looked at for voting patterns need to take into account logarithmic growth patterns.
BUT THAT’S PRECISELY WHAT BENFORD’S LAW DOES! It’s a logarithmic formula, for crying out loud. People, unless you’re a trained professional like me, don’t try do this at home in your basement.

Third, contrary to Leftist speculation, Benford’s Law is ESPECIALLY applicable to use in detecting election fraud. It has been used throughout the United States specifically for such examinations in multiple contests in multiple states in multiple elections. It has been used very successfully in other global election analysis, such as in Iran and India. So the Left’s assertions are specious on their face.
Below is how election analysis was done for the nation of India. If there was concern that in the US, precincts may be too small to get a proper base for distribution–that certainly is belied in India, with a population well in excess of a billion people.
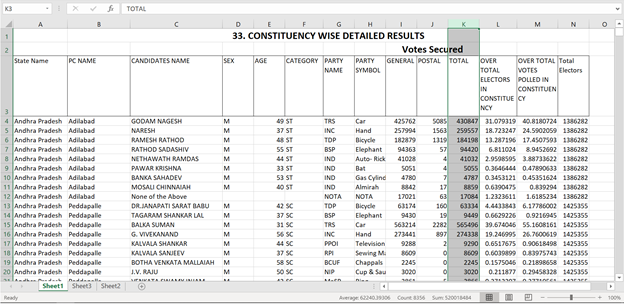
India data literally can be exported into an Excel spreadsheet and graphing.
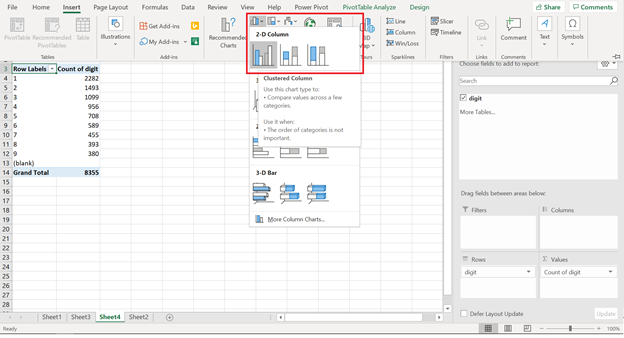
Ergo, a nice, beautiful correlation of election results to Benford’s Law—including Meban’s second-digit test, discussed below.
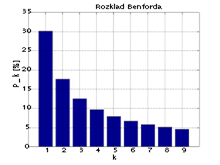
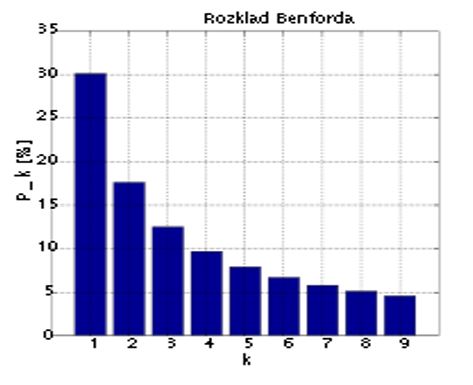
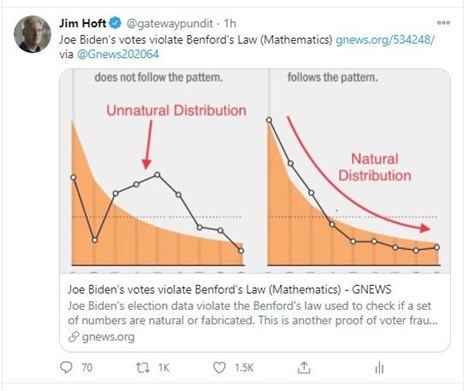
Remember, this is what a distribution should look like:
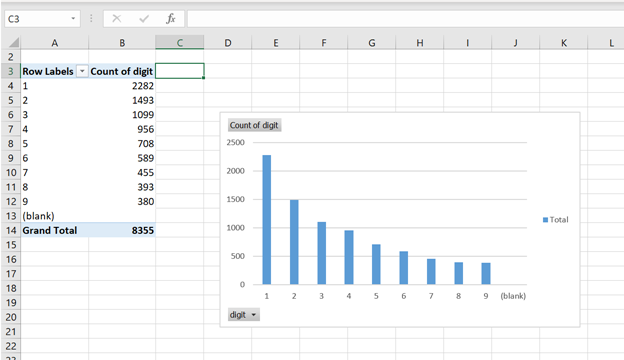
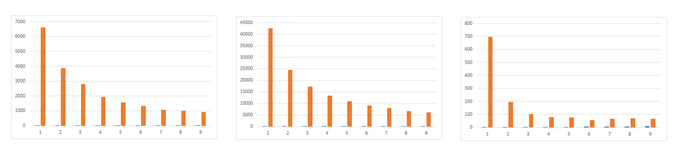
So, the General Election in India in 2019 looks good.
Below, the General Election in India from 2014 also looks to be valid.
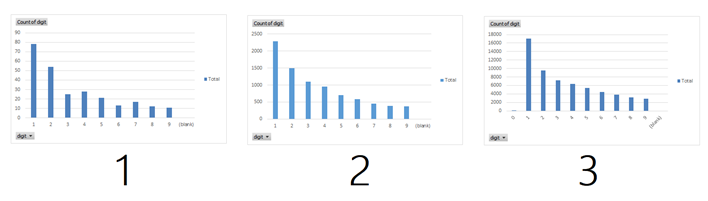
The US Senate and US House Elections from 2018 seemingly is compliant.
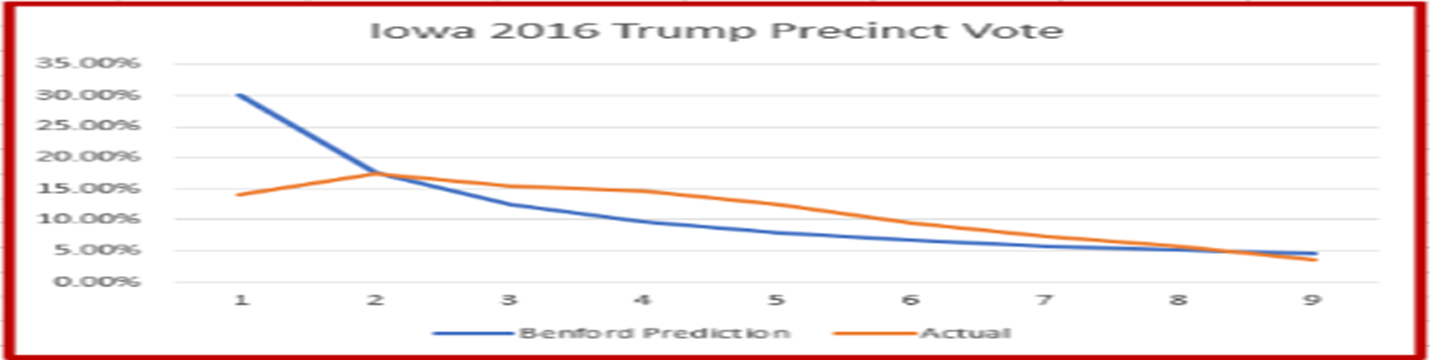
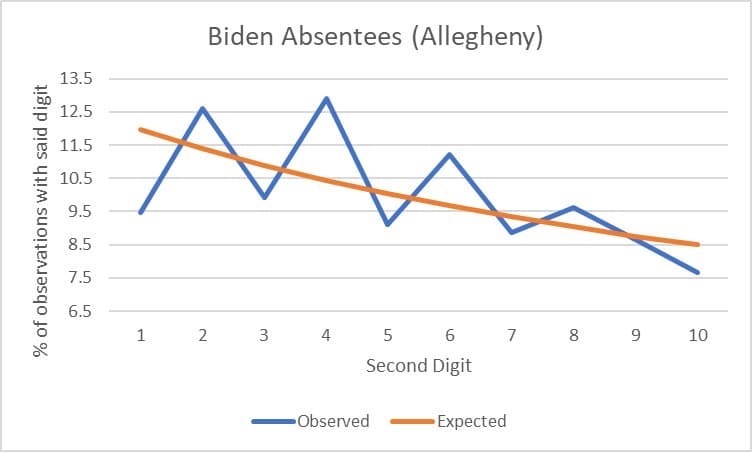
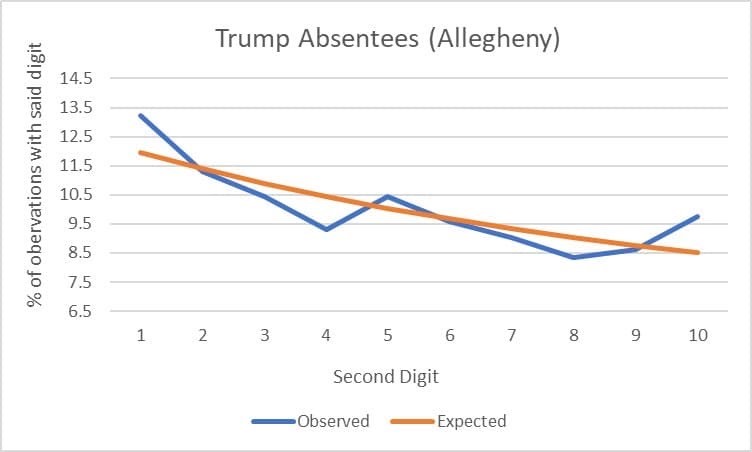
Fourth, the Left will point out the occasional graph that did not match up on the first digit. That’s because the master of this scientific field, Dr. Mebane, still living, has written authoritatively that the first digit match is not useful for detecting election fraud. It is the second-digit distribution in Benford’s Law that does so. That is why the Mebane second-digit test is used, instead. The graph referred to by below matches perfectly on the second digit.
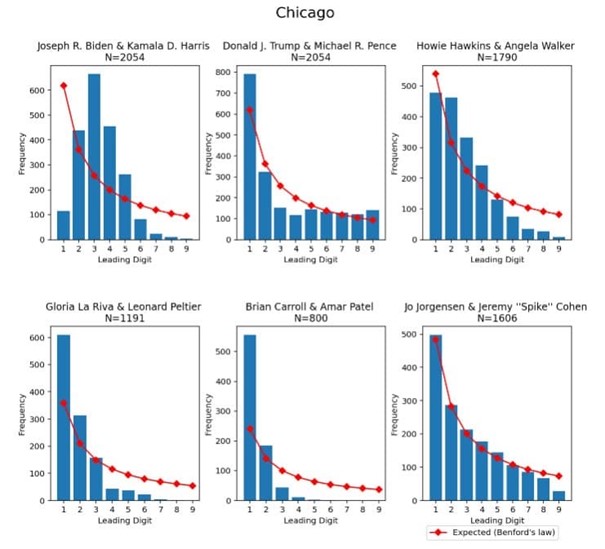
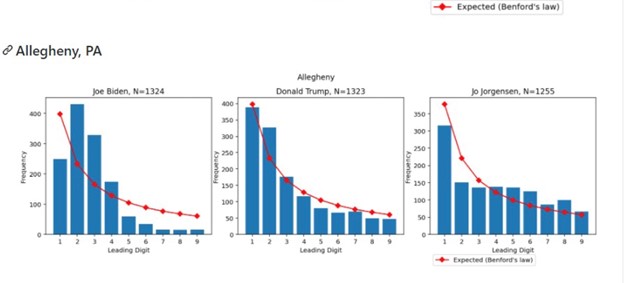
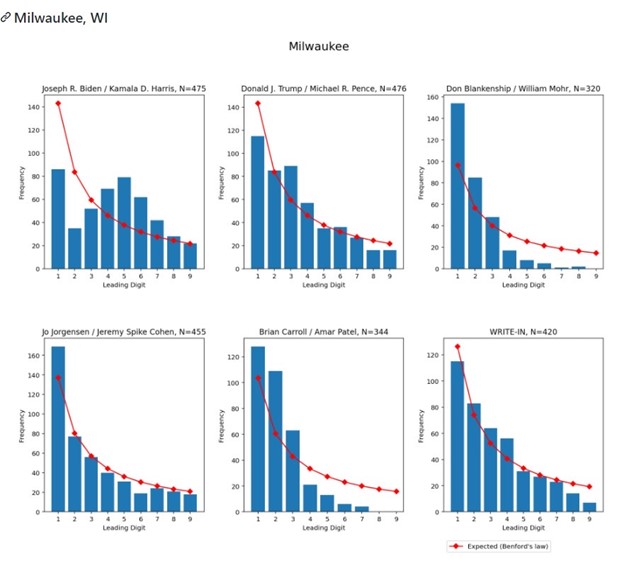
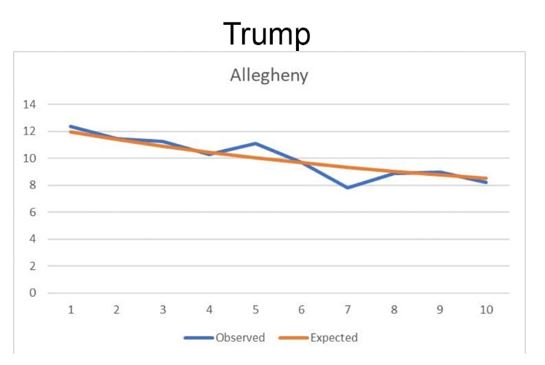
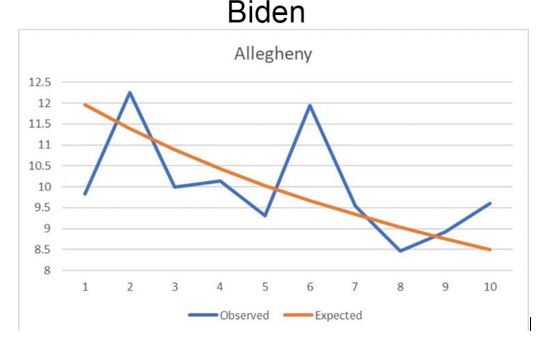
Fifth, graphs in Iowa, Ohio, Florida, where elections were run efficiently, had nearly perfect line-ups in data according to Benford’s Law. As a matter of fact, in all major cities in the US OUTSIDE OF THE RUST BELT PA, MI, WI, plus Georgia, Benford’s Law indicated legitimacy. However, the data in PA, MI, WI skewed so wildly from both the Benford distribution and the Mebane second-digit test, as to be almost statistically impossible. Demographic areas that behaved similarly all throughout the country only skewed in these Great Lakes metro areas, for the most part.
Sixth, mathematically, Biden ran behind Obama ’08, Obama ’12, and Clinton ’16 in all major metros in states, save PA, MI, WI—all states that were unique this year with millions of late mailed-in ballots being counted. There was great mailed-in votes in many other states, e.g., Ohio, Florida, but they followed Benford’s Law and were not counted sans signature matches, they allowed the observers required by law, and did not have over 1 million coming in and being counted contrary to state statute, and they did not have over 100,000 ballots that literally time-traveled (ballots received on date prior to being mailed to voter date). It’s these late suspect votes that deviate radically from both Benford’s Law and its corollary Mebane second-digit test. Chi tests also have independently confirmed Benford’s Law violations in Great Lakes area.
Seventh, I work with numbers for a living, and I’m very good at it. I with great success have run Ibbotson asset allocation portfolios using modern portfolio theory, where I hand-compute (via Excel) individual cell formulas utilizing correlation coefficient formulas to mitigate portfolio performance volatility. Whenever you see such wild variances with the results that are occurring with late-counted million-plus mailed in votes in PA, for examples, the standard deviations away from the expected mean for where they should be make probabilities to be nearly impossible.
The following is what a proper Benford’s Law distribution should look like:
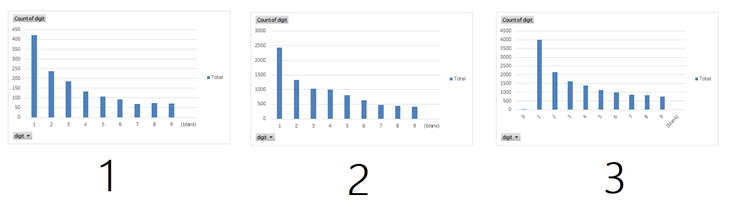
Ladies and gentlemen, please look at the following graphs. Res ipsa loquitur, as we say in the law. First and Second digits across the board line up atrociously for Biden, yet according to statistical probability for Trump. Examine the twenty-one charts below.
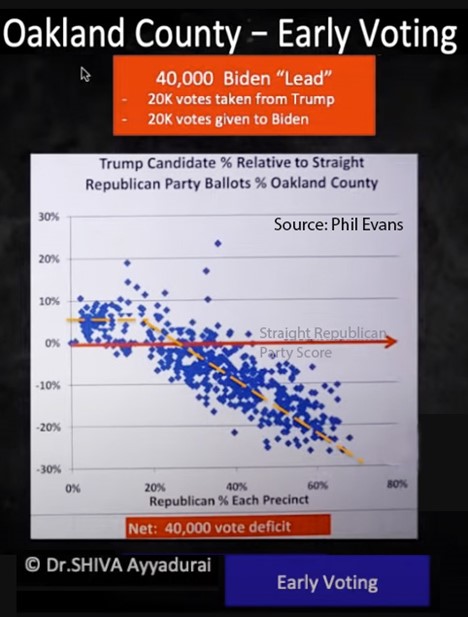
Eighth: MIT PhD and engineer Dr. Shiva Ayyadurai and his cohort have run a devastating analysis which independently shows the mathematical impossibility of the vote distributions as reported in Rust Belt areas:
X-y plotting. Now we connect the dotting–Axis of upheaval.
h/t Joanne Nova’s site:
Literally incredible. A computer transistor algorithm, switching votes from Trump to Biden in swing-state Michigan?
From the graph above, you can tell that the results mirror a perfectly executed algebraic formula. An artificial inverse correlation appears on the x-y axis, and deviates in precise formulaic manner, departing from the straight Republican Party voting tendency in “airplane crash” fashion.
At a trigger threshold, Republican votes tallied dramatically lower for Trump than all other down-ballot Republicans.
The increasing discrepancies between Trump and down-ballot Republicans correlate to the increasing dominance in percentage of Republican voters in a respective precinct.
The more Republicans there were in the precinct, by percentage—the Republicans down ballot did well as expected, but Trump’s vote totals plummeted worse than in less Republican areas. I don’t think so.
Almost as if by a computer program formula “adjusting” votes? A perfectly performing one conforming to a precise and predictable algebraic equation?
These presumptions may be rebuttable. But I’d like to see my House colleagues from the other side of the aisle address these concerns statistically, mathematically, and scientifically—not with the raw emotion of a baneful persiflage of vitriolic billingsgate.
доверяй, но проверяй, as the Russians say. “Trust but verify.” This begs for an explanatory audit.
(This data analysis is from MIT engineer Ph.D. and Fulbright Scholar Dr. Shiva Ayyadurai et al.)
Author: Jon Jacobsen, B.S.B.A., J.D.
Rep. Jon A. Jacobsen, J.D. (R-Council Bluffs), is newly re-elected member of the Iowa Legislature, as Iowa State Representative from District 22 (Pottawattamie County). Jacobsen serves in the House as Vice-Chairman of the Commerce Committee, Vice-Chairman of the Ethics Committee, and in addition is seated on the State Government and Agriculture Appropriations Committees. Jon won his 2016 election by the largest percentage margin of votes in modern district history, engendering a huge voter turnout of nearly 75% of all registered district voters for a mid-term, non-Senate cycle. A married father of three, Jon is a bank senior trust officer/vice president, attorney (Univ. of Iowa Law alumnus), and has won a dozen Iowa Broadcast News Association Awards for Radio programming, including for Political Coverage, Public Affairs, In-Depth Series, Feature, and Overall Best Use of Online Media.


